Plotting waves in Igor |

|
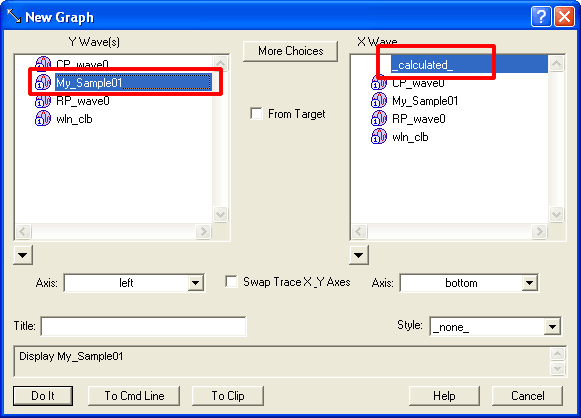
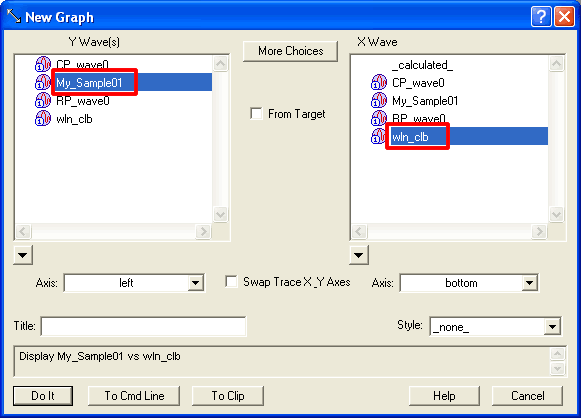
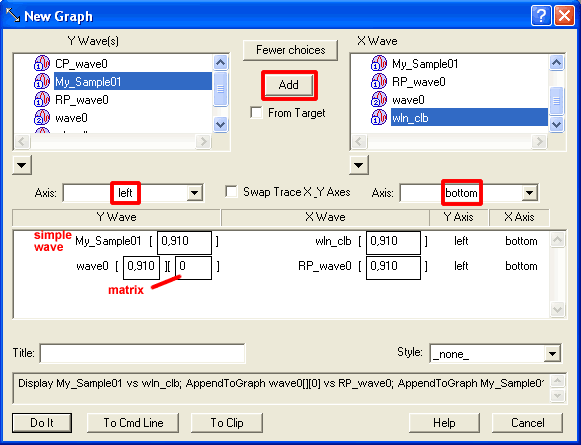
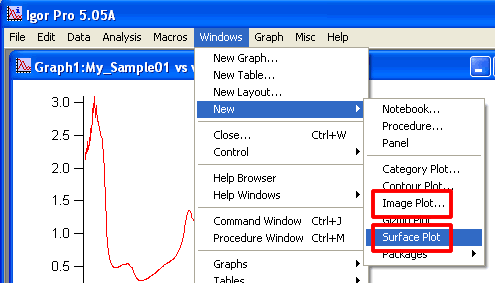
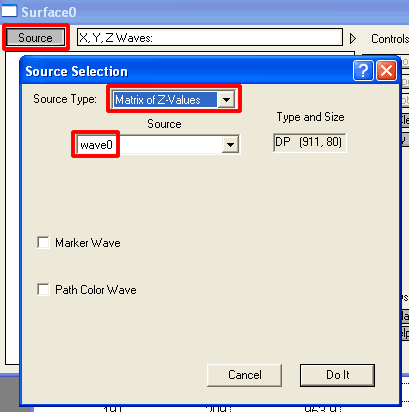
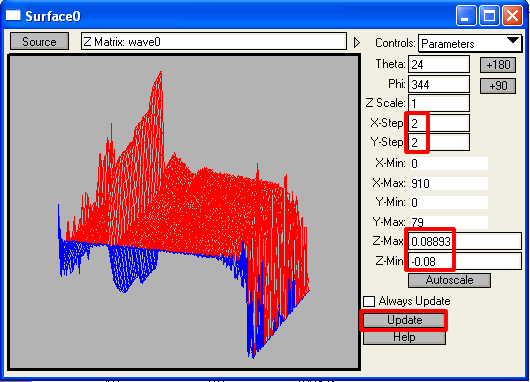
Visual representaion as a graph of one sort or another is one of basic, and most used, applications of Igor. Plotting a waveIn simple graph you display wave values sequentially or per scaling if it has been set. You get a 2D plot with little information along X axis. Open a New Graph dialog from Windows menu: Select your wave on the left and leave _calculated_ highlighted on the right. Give optional title to you graph. This will help you to locate it later on. Click Do It button and you will get a graph showing values in your wave. Plotting wave1 vs. wave2Open New Graph dialog as above: Select waves you want to plot on the left. Then select a calibration wave on the right: Adding or Removing tracesYou can freely shuffle traces displayed on a graph. Activate the graph of interest - submenu Graph will appear inthe main menu. Select Append Traces to Graph or Remove from Graph: Append dialog is identical to dialog above for creating a new graph. Remove dialog simply allows you to choose which wave to remove. Advanced PlottingNew Graph or Add Traces dialogs allow greater chioce and flexibility if needed. To switch to advanced mode click More Choices button. In this mode you can specify individual pairs of waves, choose separate axis for different wave pairs and limit ranges of data that you want to be dipalyed. Moreover, you can plot an individual row or column of a matrix vs a wave or a row/column of another matrix. Note that in the example above wave0 is a matrix and dialog specifies that column 0 of that matrix should be plotted vs row position wave RP_wave0, whcih was created when matrix was loaded. You can choose if you want to plot a column ([0,910][x]) or a row ([x][0,67]), but number of points in calibration wave must match or be limited by sub-range. For example SomeWave[100, 1010] as X wave will work for either row of the example above. It is your responsibility to make sure that such data combination makes sense. Note that when a matix is added to the list of waves to be plotted, Igor uses entire row range (x, typically wavelength) and the first column (y, typically time) as a 2D subrange by default: wave0[0,910][0]. If you want to plot spectra, for example, you will only need to change column number from 0 to the column number of interest. If you want to plot time profile, however, you will have to set row range to a single number and specify a range of columns, as in wave0[0][0,199]. Plotting a matrixDisplaying a whole matrix is useful occasionaly to get overal impression of data. There are several ways to visualize matrix data in Igor, although Image plot and Surface plot are the most pratical. Selecting Surface plot above brings Surface Graph window. It has functionality of a dialog.
Keep in mind that matrix may contain a large or very large amount of data, which will take time to process and display. To make display faster you can increase X-Step and Y-Step values. If you have 1000x200 points matrix, you may want to display every 10th point on X-axis and every 2nd point on Y-axis, for example. Surface plot does not allow you to limit the range or change scaling of X- and Y-axis. If your matrix contains regions without much information or too noisy, consider making a sub-range copy of the original matrix and displaying that copy. Matrix addressing is described in more details here. You can change intensity the scale by modifying Z-min and Z-max values. To apply changes click Update button. You can select Always Update so that all chages are applied automatically but be carefull when working with large marices. |

| Comments |

